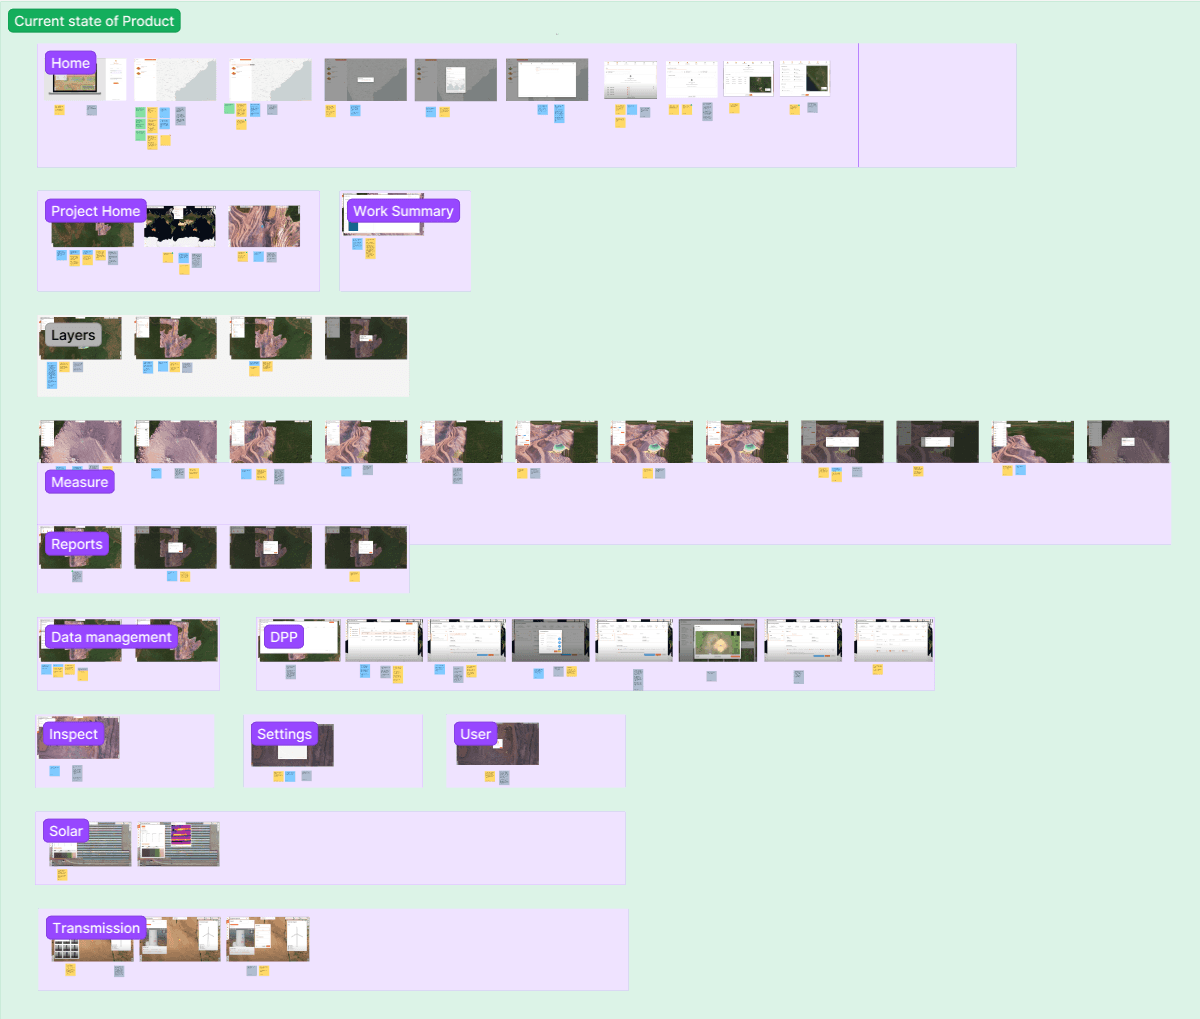
Before and after redesigning the project
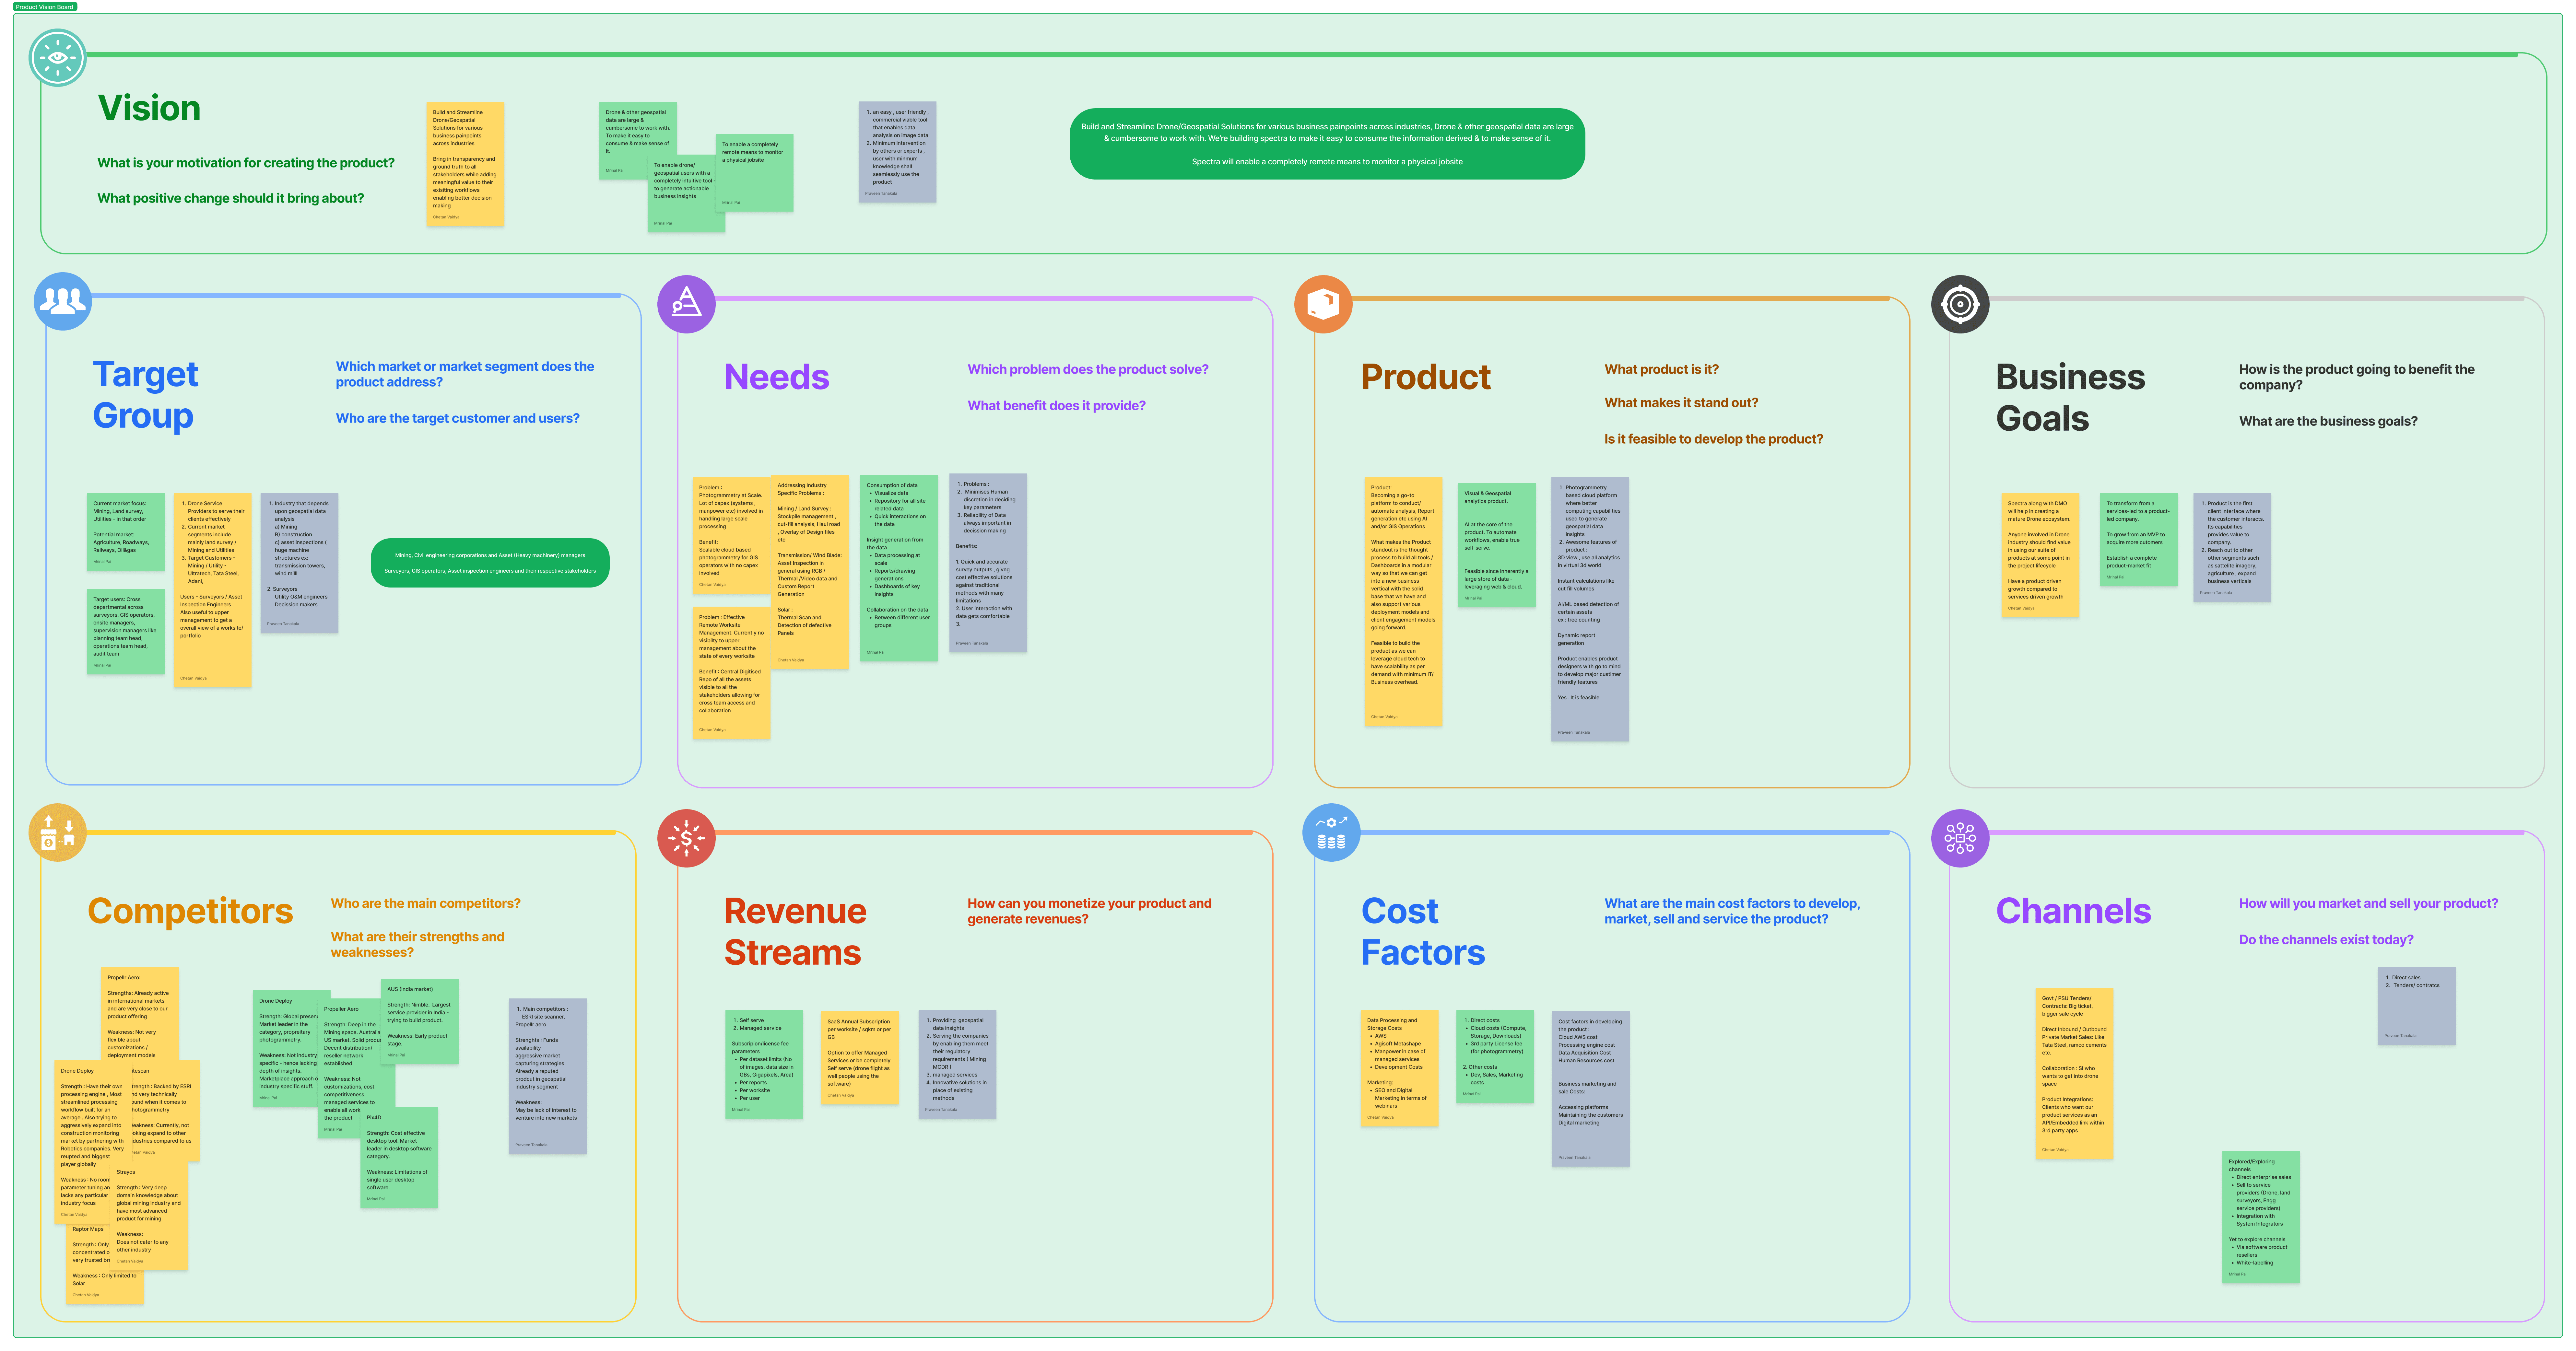
The Product Vision Alignment session for Spectra's redesign was a crucial collaborative effort that brought together diverse stakeholders including surveyors, drone operators, and industry experts. Through focused workshops, we delved into the core challenges faced by users, identifying workflow bottlenecks, user experience pain points, and critical feature needs. This intensive process allowed us to synthesize varied perspectives into a unified vision for Spectra: a seamless, intuitive platform that accelerates drone data processing, leverages AI for deeper insights, and simplifies decision-making across industries. By aligning key stakeholders early in the redesign process, we ensured that our efforts would remain firmly rooted in user needs and business objectives.
Key Outcomes:
Defined clear, prioritized objectives for the redesign
Established a shared understanding of critical user needs
Set measurable goals for the redesign process
Secured strong stakeholder buy-in for the project
Created a roadmap for feature development and UX improvements
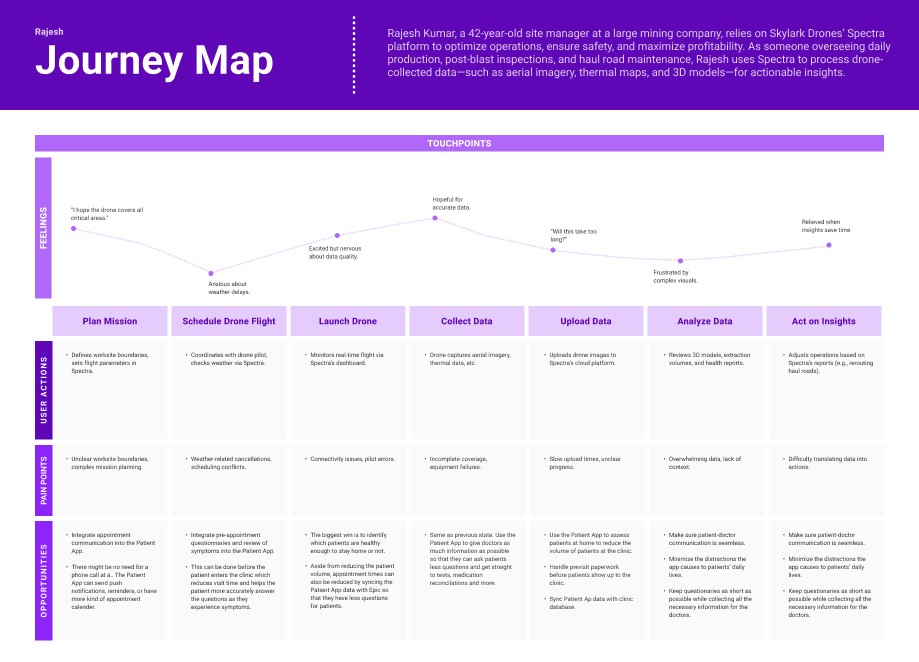
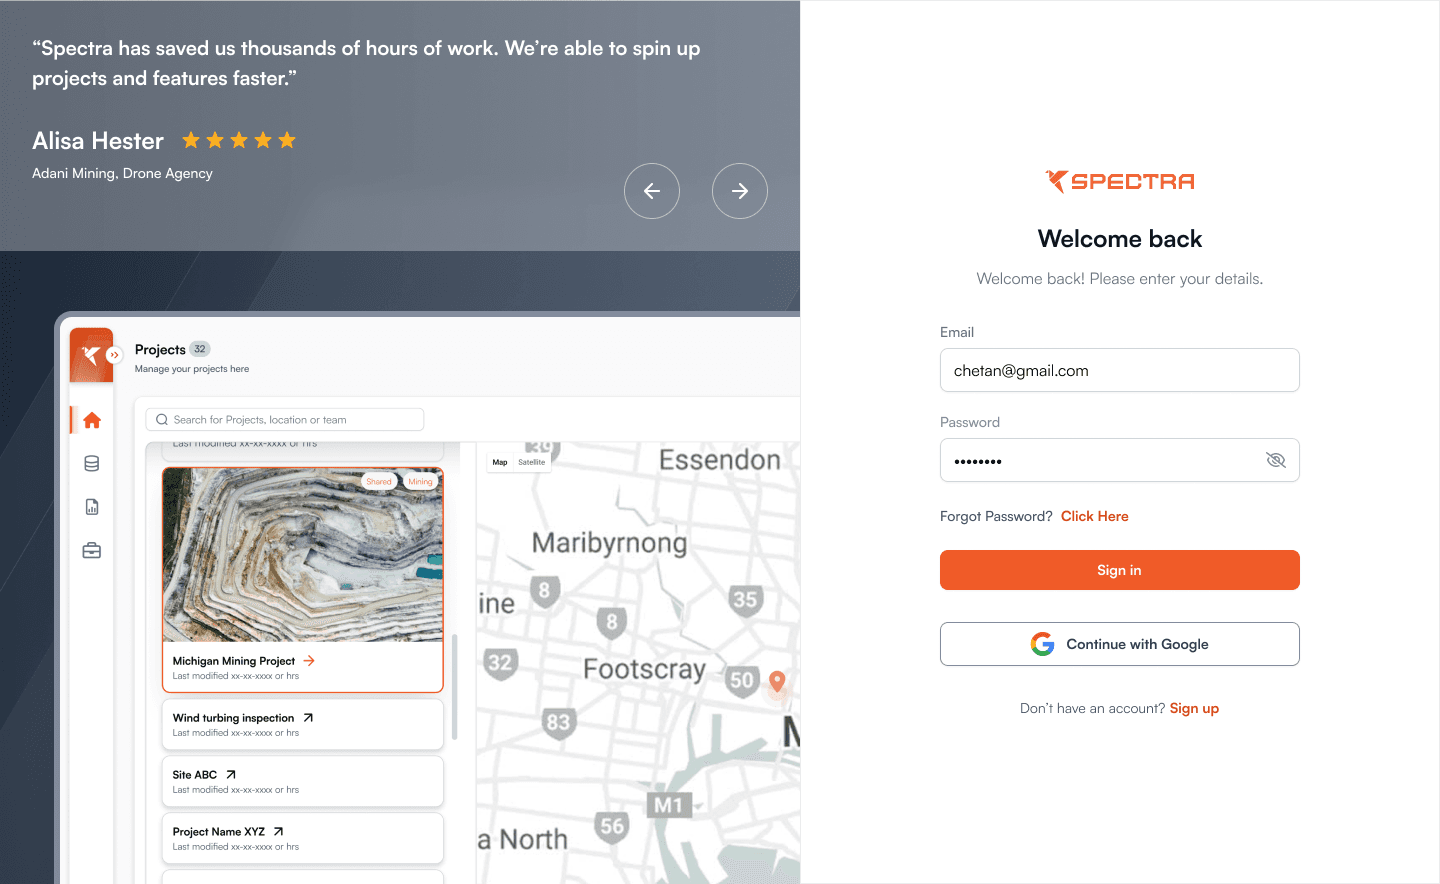
By addressing these pain points and leveraging opportunities, Spectra can reduce user frustration, improve adoption rates, and drive operational efficiency for enterprises. For Rajesh and similar users, a more intuitive, efficient platform will save time, enhance safety, and maximize profitability—aligning with Skylark Drones’ mission to “unlock the economic potential of aerial intelligence.”


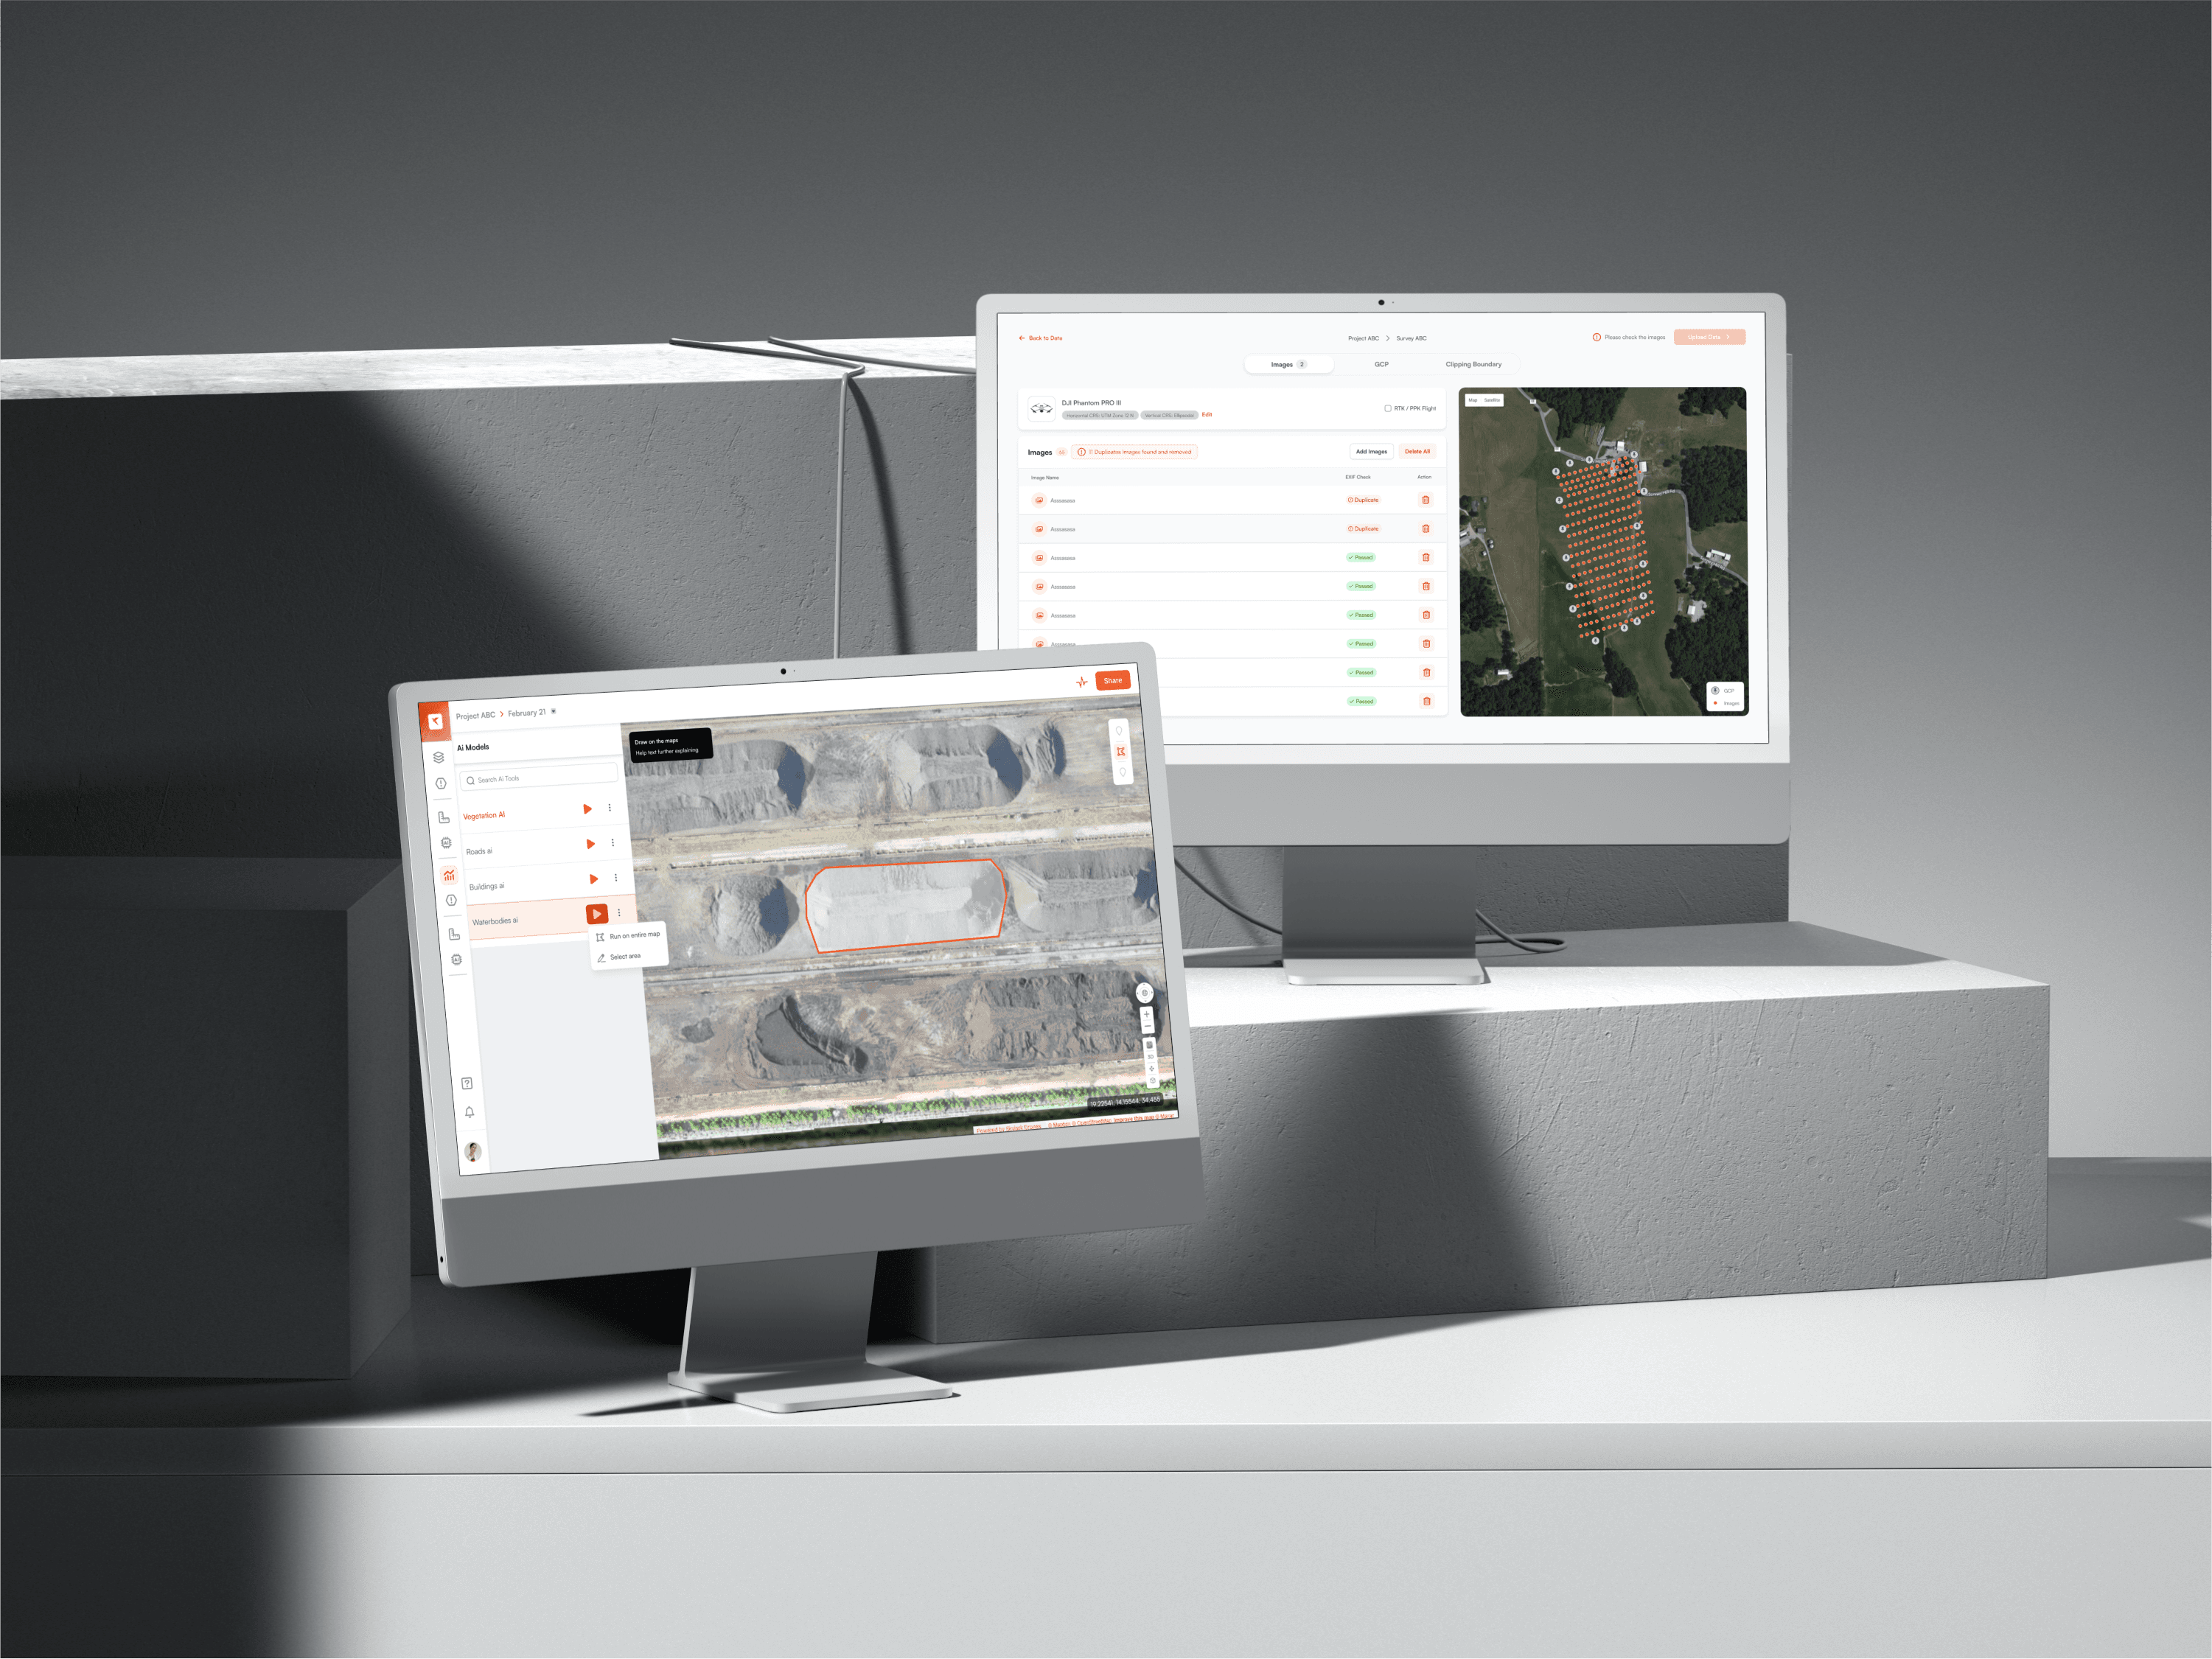
Wireframing and RAPID PrototypinG
Low-fidelity wireframes were created to:
Test different layout structures, particularly focusing on how users would interact with large datasets and visualizations.
Prototype workflow enhancements, such as automatic data processing triggered by a single action.
Tools used to test out initial prototypes - Usertesting, Maze and Figma
The Spectra Design System is the foundation of Skylark Drones' flagship software platform, enabling seamless integration of complex drone data processing, analysis, and visualization features. It was architected not just to unify one product, but to lay the groundwork for scalable, token-driven design across an expanding ecosystem—starting with Spectra’s flagship drone analytics platform and extending to Drone Mission Ops, internal admin tools, and future enterprise applications.


We began with a cross-disciplinary discovery sprint that included design, frontend engineering, QA, and PM stakeholders. Together we:
Audited UI inconsistencies and divergent styling approaches.
Defined a shared vocabulary and goals: consistency, scalability, accessibility.
Aligned on adopting a token-first architecture and platform-agnostic tooling.
This early alignment created psychological safety, fostered buy-in, and paved the way for seamless cross-functional ownership.
Token Taxonomy and Architecture
We drew inspiration from industry leaders like Airbnb’s DLS, Nathan Curtis' "Naming Tokens", and Salesforce’s Lightning System. Our taxonomy was designed to support:
Multi-brand usage
Theming (light/dark/enterprise)
Platform-specific customization across product domains
Token Layers:
Global Tokens: Lowest-level primitives
(e.g.,color.orange.600,font.base,space.4)Alias/Semantic Tokens: Abstracted intent
(e.g.,color.accent.600,border.radius.md,shadow.card)Platform/Product Tokens: Namespaced for product-specific usage (e.g.,
spectra.button.primary.default.bg)Component Tokens: Used inside actual UI
(e.g.,
button.bg.default,input.border.focused)Variant-State Tokens: Capture UI interaction context
(e.g.,
admin.input.text.placeholder.disabled)

This semantic ladder ensures traceability from raw color to context-rich implementation.

Badge tokens were unified across usage contexts without introducing variants like badge.sm or badge.lg, making them highly reusable and theme-friendly.
We built a centralized token system that acts as the foundation for both design and code. In our architecture, Tokens Studio in Figma serves as the authoring surface, while the version-controlled tokens.json file is treated as the single source of truth shared across all platforms.
Token Flow:
Tokens are authored and maintained in Figma via Tokens Studio
Synced to a canonical
tokens.jsonfile stored in GitHubTransformed via Style Dictionary into:
CSS variables for web
SCSS maps for legacy applications
iOS
.xmland Android.jsonformats for native platformsJSON for documentation systems and Storybook theme contexts
Used by design via Figma Variables and by dev via multi-format exports
Integrated with CI/CD pipelines for versioning, validation, and changelog generation
This system ensures design and engineering remain in sync, and that every update to tokens is tracked, tested, and deployed consistently across all environments.
Tooling Stack for Synchronization
Figma variables + Tokens Studio: Author and preview tokens
Style Dictionary: Transform and distribute
Storybook: Preview token-applied components and themes
Chromatic: Snapshot testing and regression validation
GitHub CI/CD: Token linting, versioning, and auto-deploy
Documentation & Governance
Storybook and figma worked out as the go to documentation
Token proposals are submitted via PRs and reviewed weekly
Deprecated tokens go through a lifecycle with warnings and migration paths
Docs include Figma previews, usage do’s/don’ts, and accessibility guidance
Scaling
Spectra: Base token system created here
Drone Mission Ops: Extended with high-contrast brand styling (
droneOps.*tokens)Admin Tools: Customized input-heavy components with distinct token needs (
admin.*tokens)
Teams were empowered to extend or override locally, while inheriting global consistency.
Token Versioning & Change Management
Each token change is versioned via semver
Breaking changes (renames, deletes) require migration notes
CI diff tool reports unused tokens and cross-references usage across codebases
Weekly changelog includes:
Added tokens
Deprecated tokens
Token mappings
The implementation of the Spectra Design System yielded measurable results that significantly improved design and development efficiency across the organization.
50% Faster Design-to-Code Cycles By centralizing tokens and integrating them directly into Figma and Storybook, designers and engineers could work from a shared source of truth. This eliminated redundant handoff steps and reduced the average time from design spec to coded implementation by half.
100% Token Coverage in Spectra UI Kit All foundational UI components—buttons, forms, modals, and cards—were rebuilt to consume design tokens exclusively. This ensured complete themeability, consistency, and simplified downstream updates across breakpoints and interaction states.
38% Improvement in Visual QA Coverage The integration of Chromatic and CI pipelines for token updates helped us catch regressions early. Visual diffs surfaced inconsistencies automatically, reducing manual QA effort and increasing test reliability.
Rapid Adoption: 3 Teams Migrated in Under 1 Month With clear documentation, a reliable token delivery mechanism, and cross-functional onboarding, three separate product teams transitioned to the token system in less than four weeks. These included Drone Mission Ops, internal Admin Tools, and mobile dashboards. that significantly improved design and development efficiency across the organization.
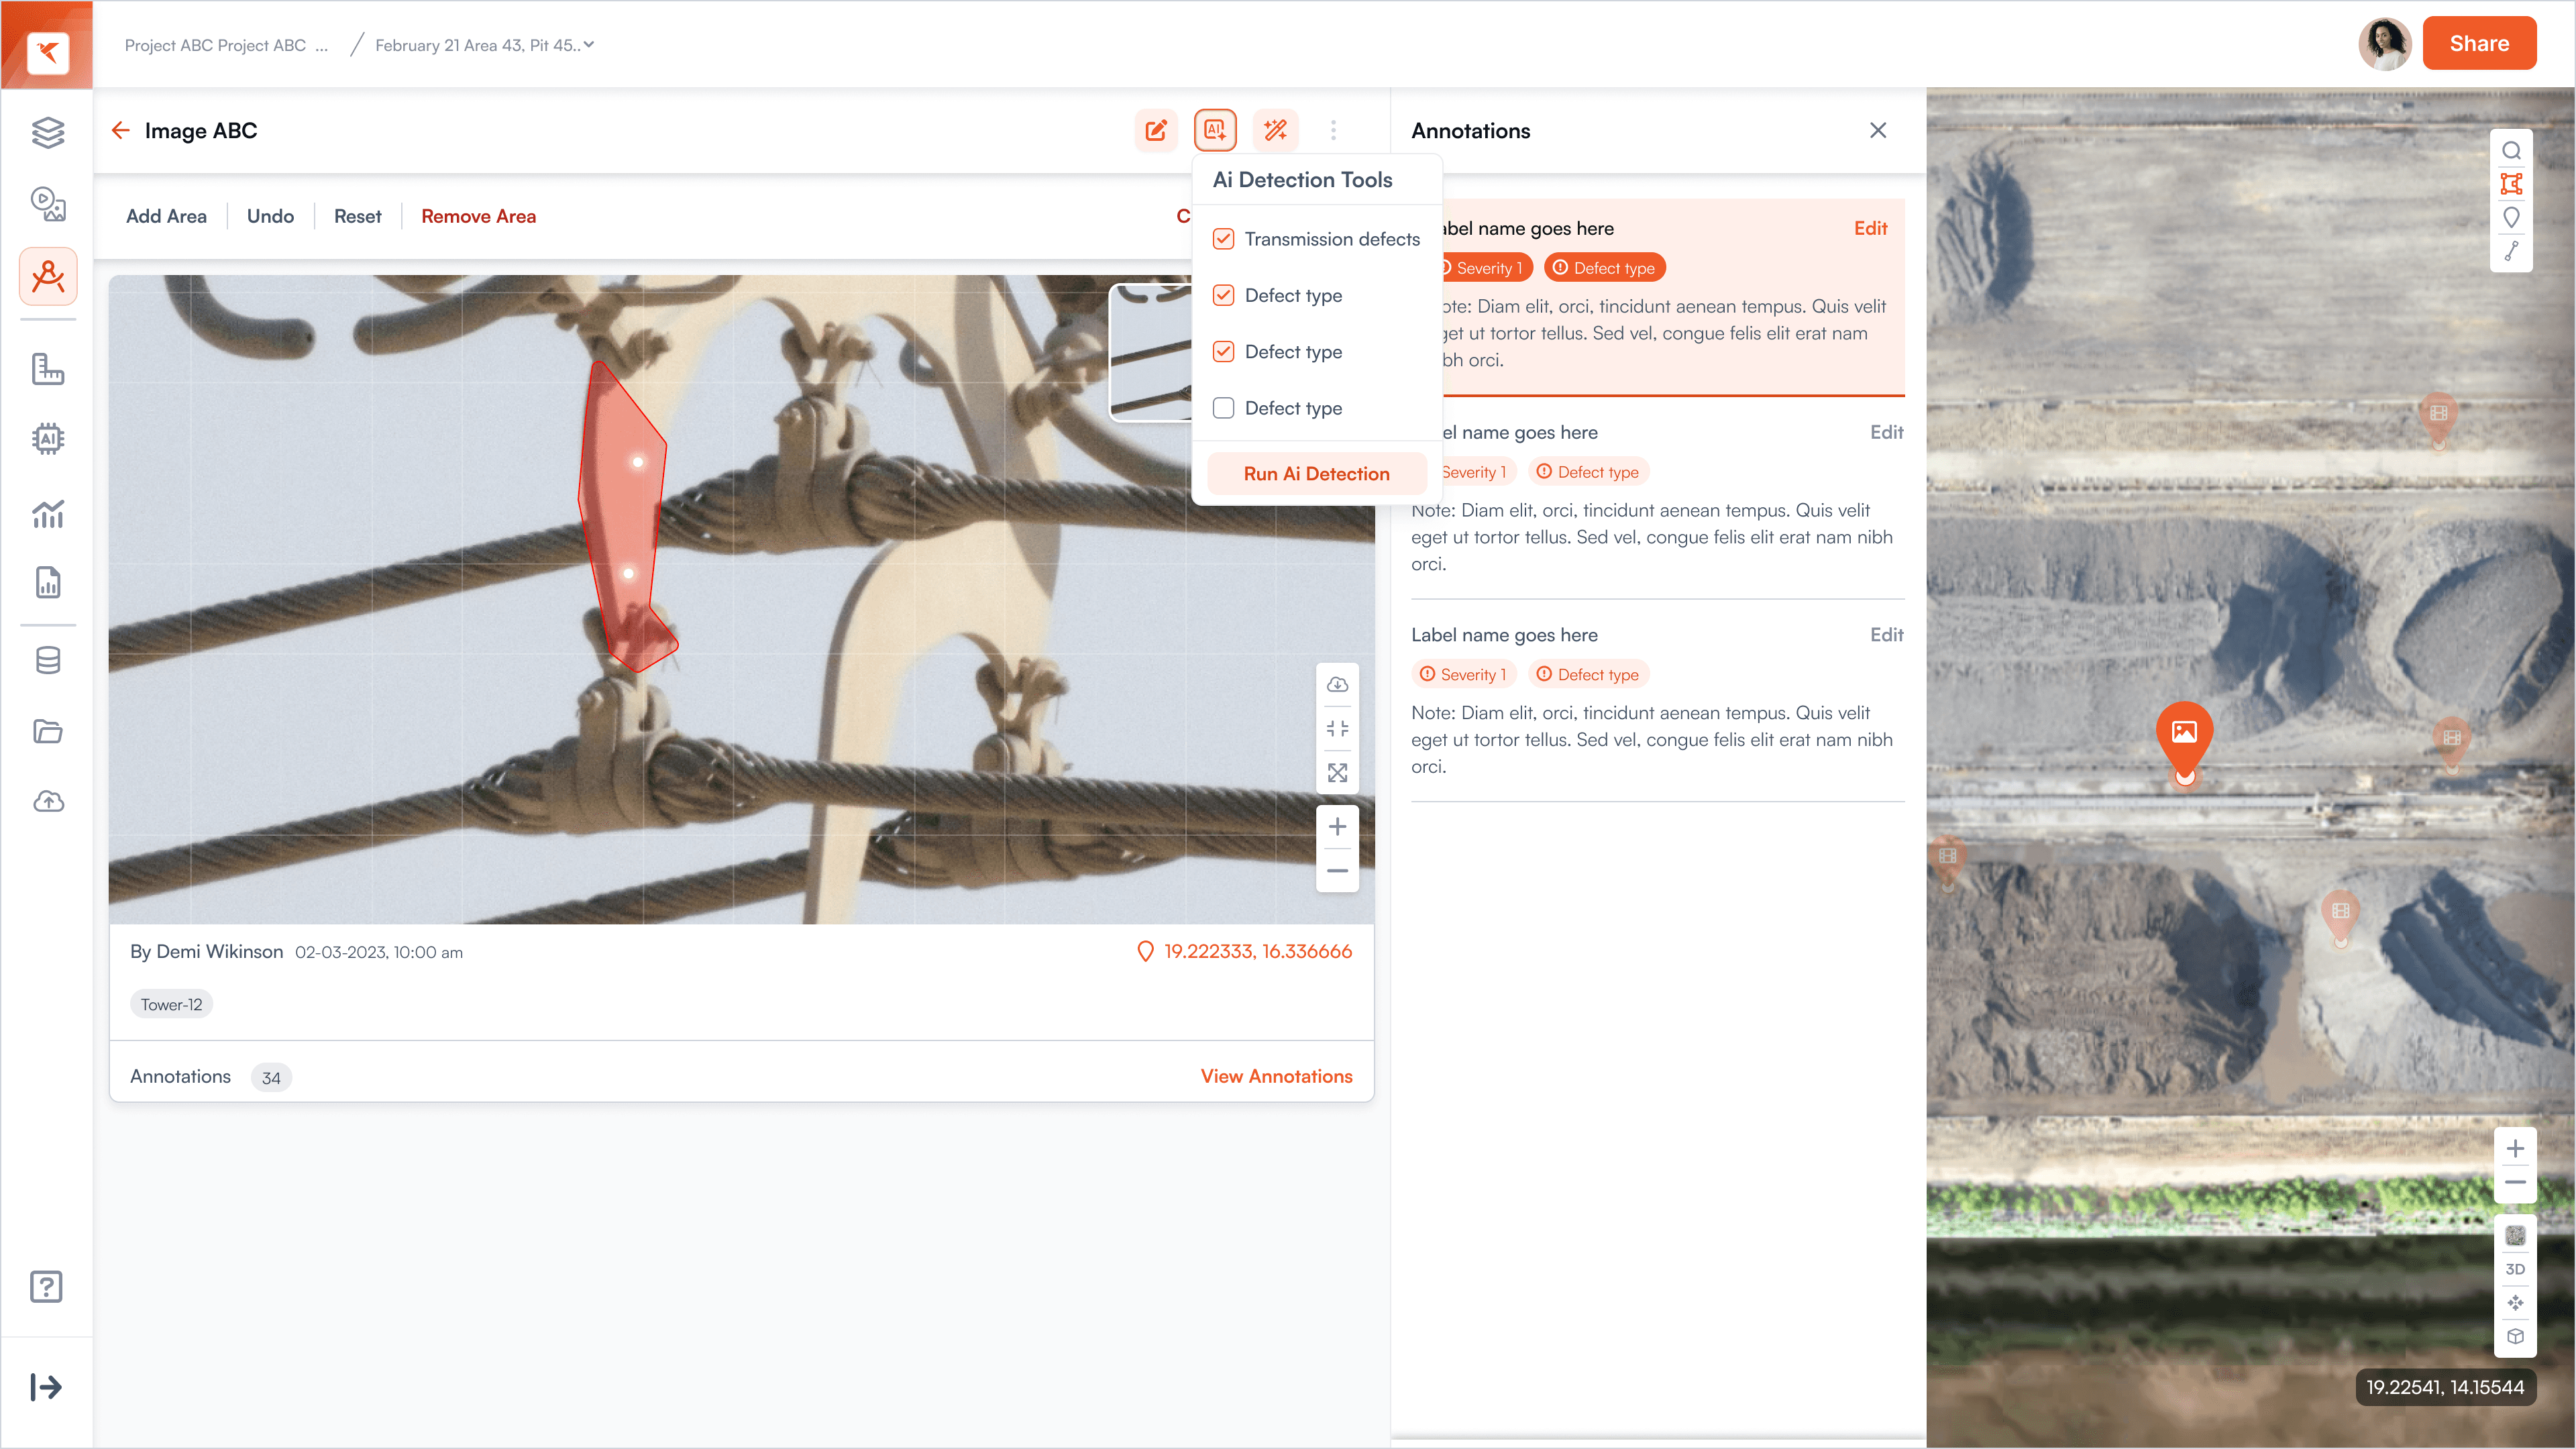
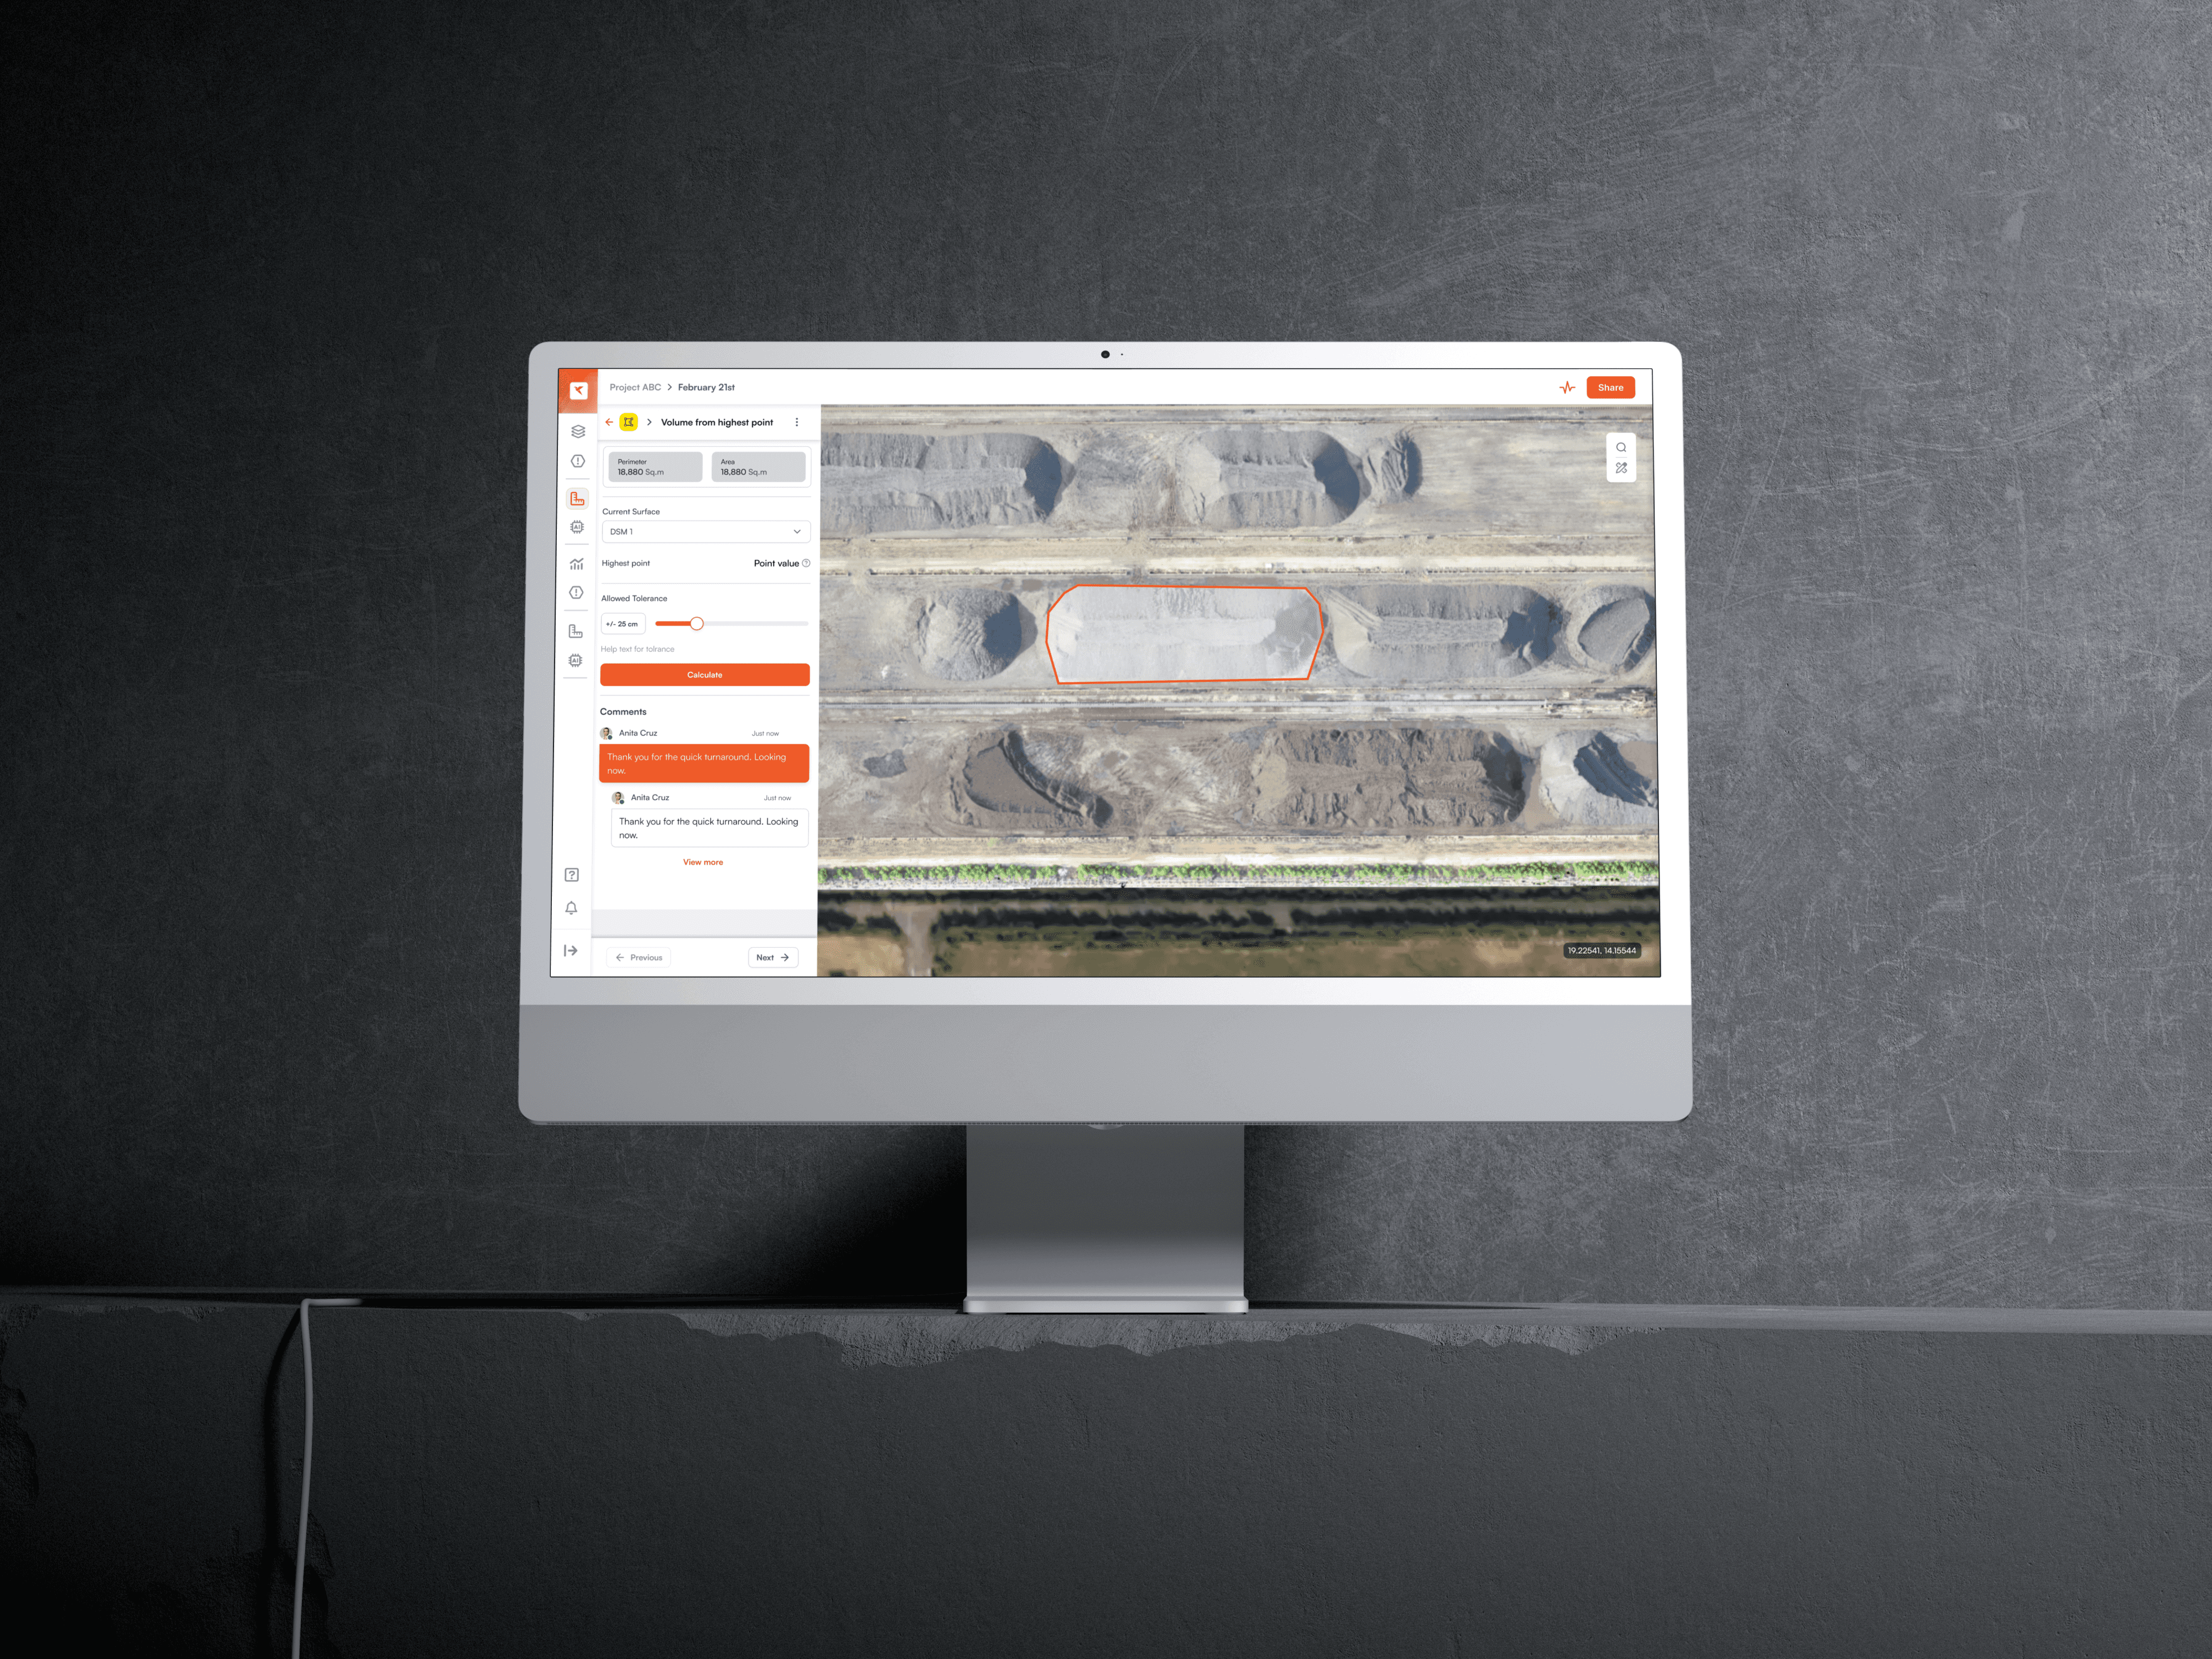
Modular Component Library
Scalable UI elements optimized for displaying geospatial data
Customizable data visualization components for 2D/3D renderings
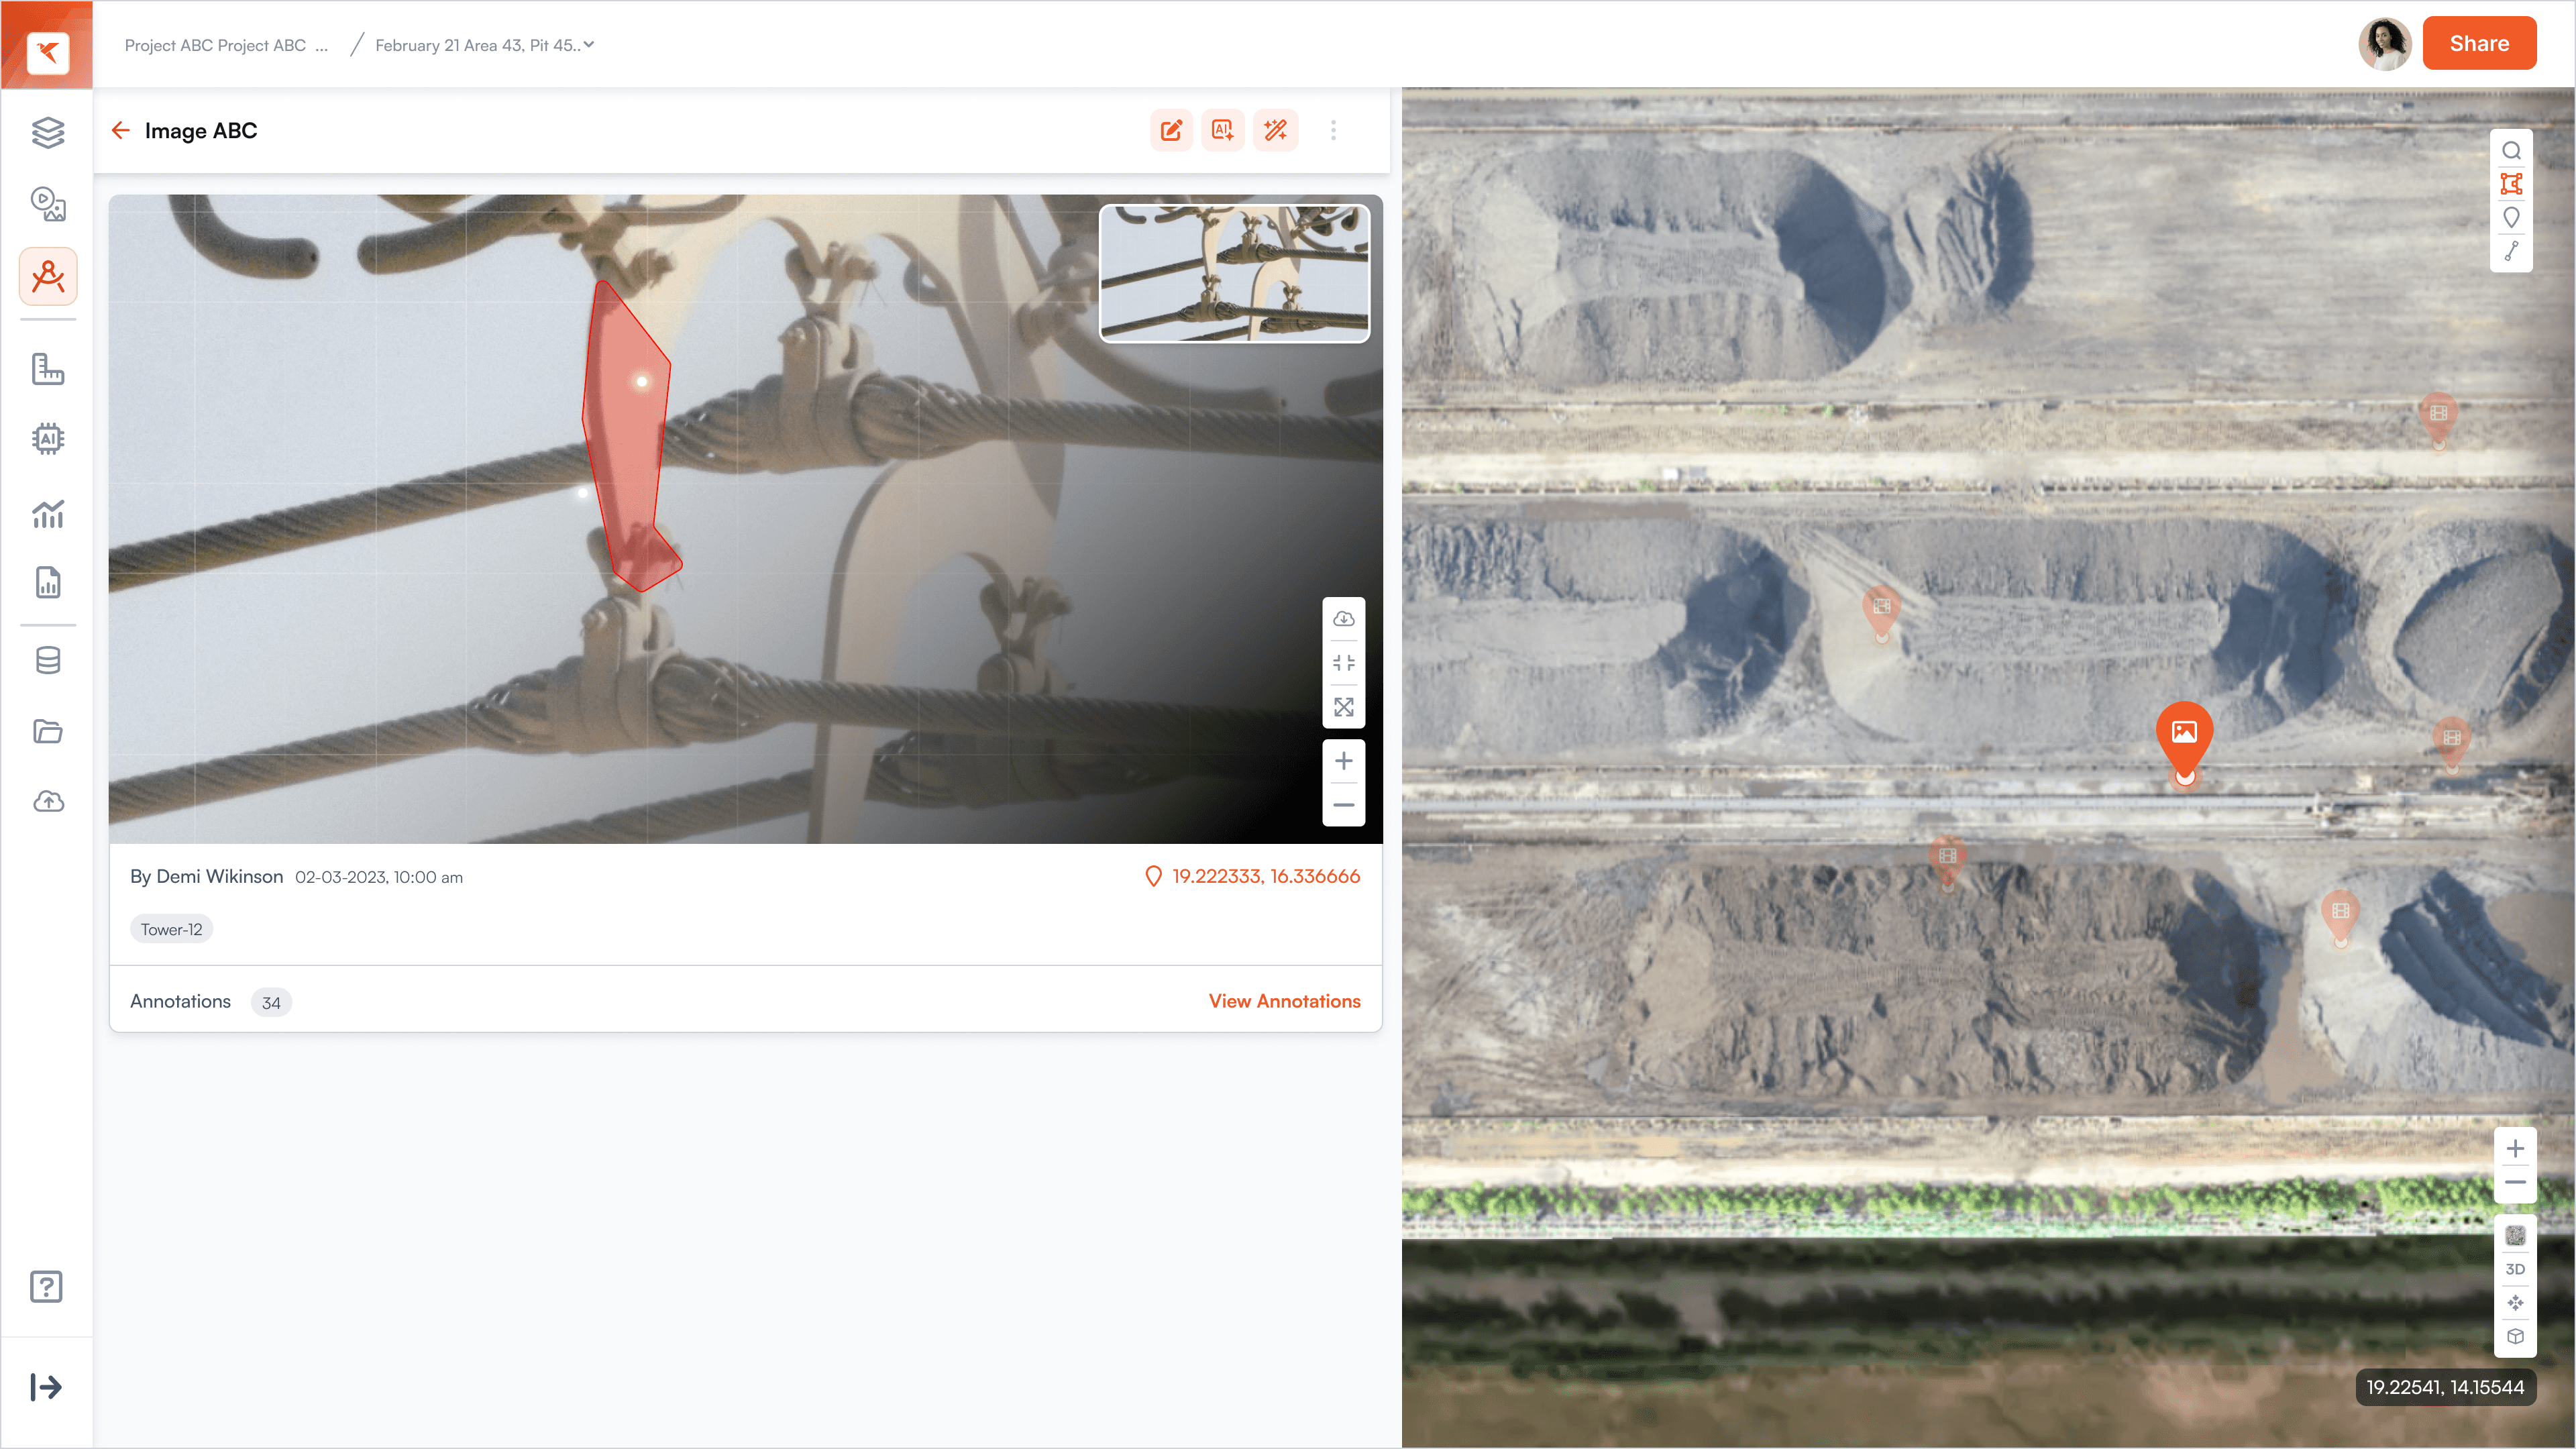
An Intelligent Compliance Dashboard for Mine Operations
To empower mine managers and oversight teams with a clear, real-time view of operational compliance across mining zones, enabling faster decision-making and actionable insights from complex survey data.
Mining operations generate large volumes of spatial and compliance data, often hard to interpret. Our challenge was to distill this data into a visual system that simplifies pattern recognition, flags risks early, and supports regulatory compliance.


Key Features & UI Highlights:
Deviation Visualization Overview:
Leveraged pie charts, heatmaps, and deviation bars to create an at-a-glance understanding of slope and width deviations across units. This helped users prioritize areas needing immediate attention.Interactive Unit Drill-down:
The UI enabled unit-wise exploration of compliance, showing both slope and width metrics in a clean, layered format. A color-coded system instantly communicated the severity of deviations.Plan vs. Quantity Compliance View:
A dual-card layout compared planned vs. actual excavation data with deviation percentages. Users could identify over-extraction or non-compliance instantly, backed by geo-anchored maps.Survey Comparison Interface:
Line graphs were used to compare elevation changes between surveys, supported by a live satellite map. This helped teams visually validate deviations in terrain and dump areas.Compliance Filtering and Reporting:
Enabled filtering by compliance status and team member, and one-click export of reports in DXF format, supporting field operations and regulatory audits.
Impact:
Reduced compliance review time by over 60%
Enabled real-time, map-anchored deviation reporting
Improved cross-team alignment via a visual-first, interactive design