Consumer decision journey
Consumer decision journey
Empowering Strategic Brand Insights
Empowering Strategic Brand Insights
2016-2017
2016-2017
Mckinsey & Company
Mckinsey & Company
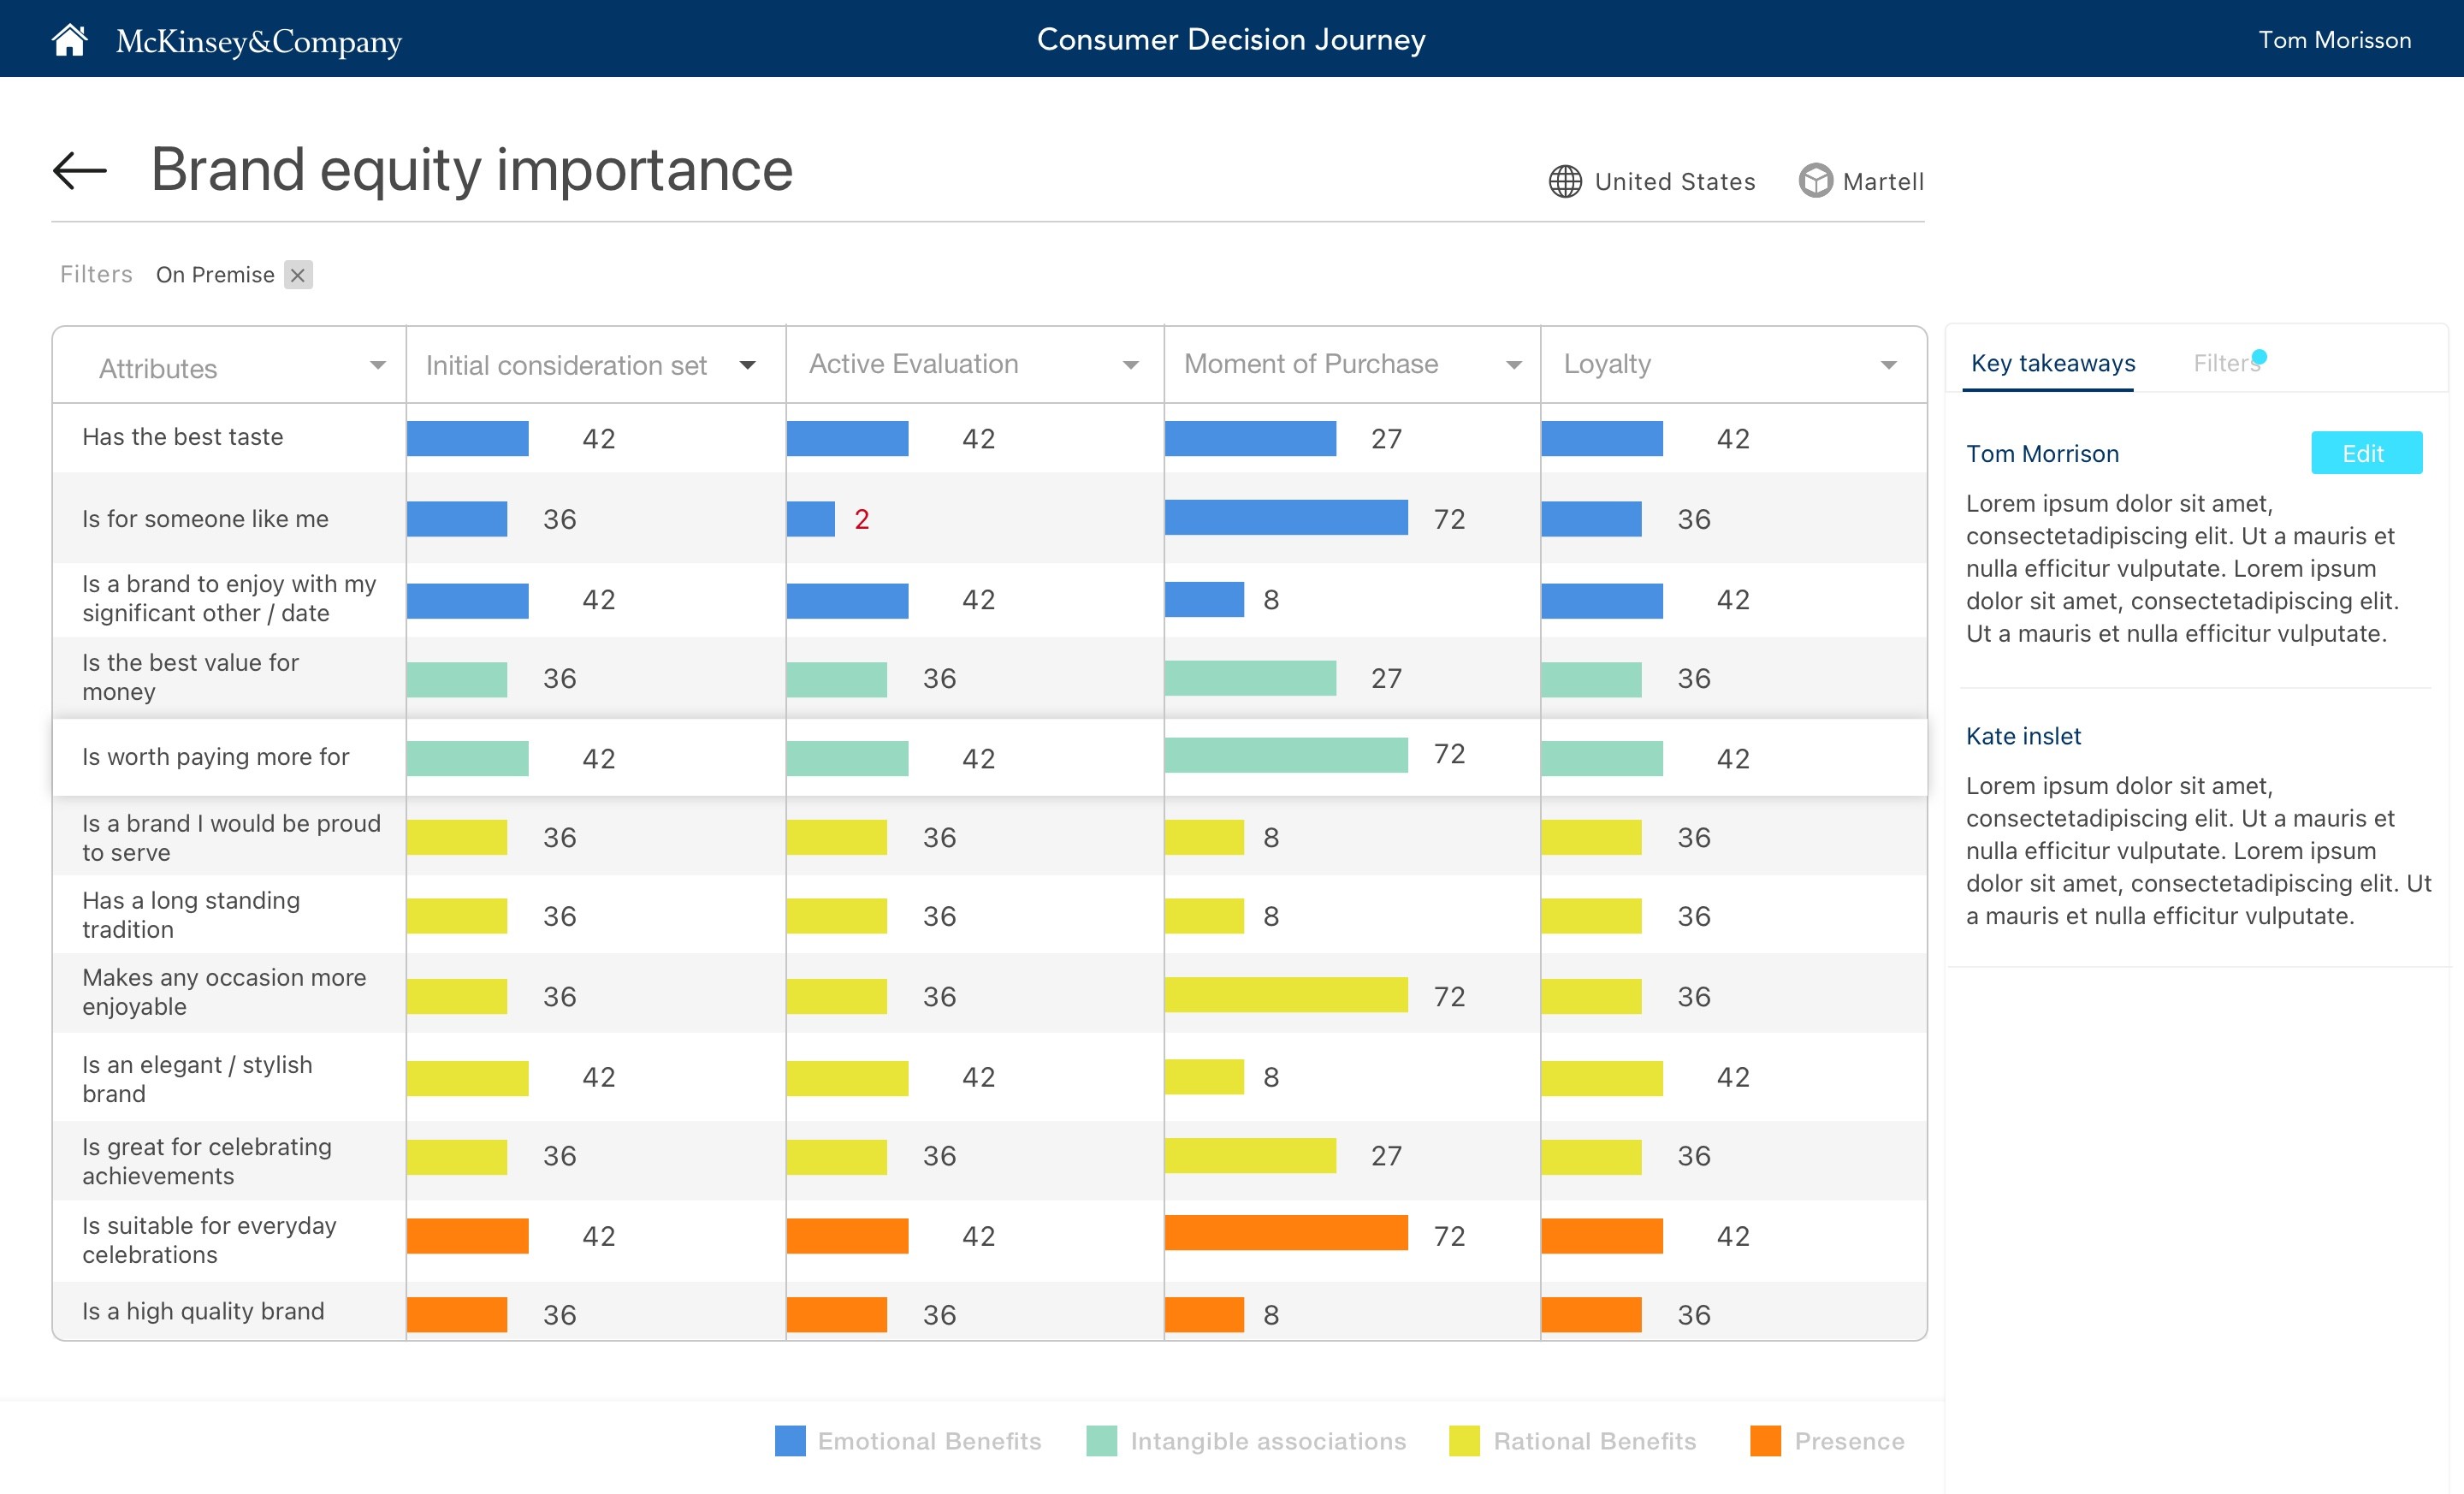
At McKinsey & Company, I led the design of an interactive dashboard suite to visualize the full spectrum of brand performance across various consumer decision touchpoints. The project aimed to equip brand and strategy teams with a granular yet intuitive platform for analyzing brand equity, conversion strength, and cross-consideration across multiple markets.
The dashboard was built with a modular structure—offering clear segmentation across equity statements, touchpoint impact, brand strength, comparative profilers, and cross-consideration maps. Each screen was optimized for visual clarity and decision-making flow, using progressive disclosure to reduce cognitive load and help stakeholders drill down from macro performance to micro-level consumer sentiment.
We used color-coded legends and performance bars to clearly communicate areas of strength vs. opportunity. Smart filters allowed users to toggle between on-premise/off-premise segments, explore battleground markets, and compare brand performance head-to-head.
Outcome: The dashboard enabled teams to identify underperforming touchpoints, optimize brand messaging, and make data-backed investment decisions—driving smarter, faster brand growth strategies.


More Works SEE ALSO
More Works SEE ALSO